

A compressor-room pressure reading cannot explain why a factory still loses capacity, runs compressors unloaded, or pays for air that never reaches production. A properly bounded audit measures the complete system, links energy use to delivered air, and gives you a defensible sequence of repairs, controls, and equipment decisions.
Key takeaways
- Define the boundary from compressor intake to every end use and condensate discharge.
- Measure power, pressure, flow, and operating state during production and shutdown.
- Separate leaks, artificial demand, and distribution restrictions before choosing upgrades.
- Rank improvements by energy savings, production risk, cost, and verification method.
Define the Audit Boundary and Establish a Baseline
Draw the compressed-air system boundary from compressor air intake to every point of use and condensate discharge. Include compressors and controls, receivers, dryers, filters, distribution piping, hoses, end uses, automatic drains, oil-water separators, and heat-recovery equipment. ISO 11011 divides the assessment into data collection, analysis, and improvement, so a compressor-only review will miss downstream losses.
1. Record each compressor’s make, model, motor rating, control method, discharge pressure, cooling method, rated flow, and operating status. Do not use nameplate horsepower or rated free-air delivery as an efficiency baseline.
2. Collect compressor logs and utility bills for at least a representative billing period. Record compressor-room operating hours, production shifts, weekends, electricity use, loaded hours, unloaded hours, discharge pressure, and maintenance events.
3. Map each receiver’s volume and location, then identify dryers, filters, drains, and pipe branches. Note filter and dryer pressure-drop readings, drain failures, condensate disposal records, and oil-water separator performance.
4. List major end uses, their operating schedules, required pressure, and restrictions caused by small hoses, blocked filters, regulators, or unsuitable nozzles.
5. Establish the baseline using measured power and delivered flow at actual inlet conditions, pressure, cooling, and control state. Express specific power as kW per 100 cfm or kW per m³/min, then compare production, idle, and shutdown conditions.
Measure the System During Production and Shutdown
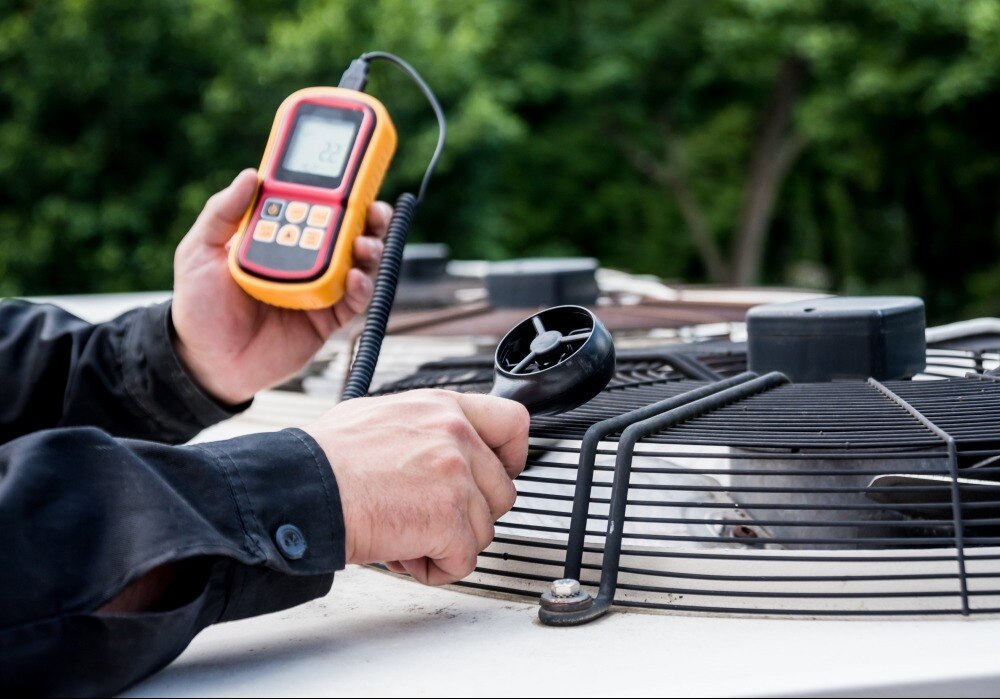
Install a temporary kW meter at each compressor’s electrical supply, and place a flow meter downstream of the receiver, dryer, and filters. Fit pressure gauges at the compressor room, receiver, before and after each dryer or filter, along the main headers, and at critical points of use.
Take pressure readings simultaneously; a discharge reading alone cannot show end-use pressure drop.
| State | What to measure | What the readings reveal |
|---|---|---|
| Production | kW, kWh, flow in m³/min or CFM, pressure in bar(g), ambient temperature, compressor loaded and unloaded hours | Base load, trim load, peaks, pressure drop, and actual delivered air |
| Shutdown or weekend | Flow, pressure, kW, loaded and unloaded time, compressor run hours, and operating schedule | Leakage, artificial demand, and compressors running without production |
Use the ultrasonic leak detector while the system is pressurized and operating, then tag each leak, repair it, and retest it. Do not estimate leakage from audible noise alone.
Log measurements across representative shifts and operating states, not one spot reading. Include receiver volume, dryer and filter pressure drop, condensate losses, and the pressure available at the end use during peak flow. Record the compressor’s control state and inlet conditions with every test.
Turn Measurements into Efficiency and Capacity Findings
Calculate specific power as compressor input kW divided by delivered air flow in m³/min; report it as kW per m³/min. Use stable production readings at the actual inlet temperature, discharge pressure, cooling method, and control state. Nameplate horsepower and rated free-air delivery do not prove operating efficiency.
- Estimate leakage during an operating, pressurised shutdown by measuring flow while production equipment is off. That flow approximates leakage and artificial demand; an ultrasonic survey locates the sources. Compare compressor capacity with loaded and unloaded hours when no flow meter is available, then repair, tag, and retest each leak.
- Assess pressure drop from simultaneous readings at the compressor outlet, receiver, dryer and filter outlets, main headers, and critical points of use during peak flow. The decisive figure is pressure available at the end use, not a short compressor-discharge reading. A pressure increase used to mask restriction adds energy cost; DOE guidance commonly estimates about 1% more compressor power per 2 psi.
| Measure | Actual audit | Rated comparison |
|---|---|---|
| Specific power | kW ÷ delivered air flow | Compare at matching pressure and inlet conditions |
| Capacity | Delivered air flow at peak demand | Compare with rated free-air delivery |
| Pressure | End-use pressure under load | Check whether the compressor rating meets the required setpoint |
| Operating profile | Base, trim, peaks, unloaded hours | Identify excess capacity or insufficient capacity |
Log several representative shifts and shutdown periods before choosing a compressor or receiver.
Separate Leakage, Artificial Demand, and Distribution Restrictions
Trace poor performance by comparing flow, pressure, and power at each system boundary rather than blaming the compressor. A leakage audit uses ultrasonic inspection while the plant is pressurised and operating; repeat it during shutdown to separate production demand from the base leak load. Tag, repair, and retest each leak.
- Excessive pressure: compare compressor discharge pressure with the minimum pressure required at the most demanding machine. If reducing header pressure lowers flow without causing a process fault, uncontrolled consumption was artificial demand.
- Artificial demand: isolate or regulate unused branches, then measure flow from open blowing and air knives. Replace oversized nozzles with correctly sized, pressure-controlled devices.
- Treatment restriction: record pressure before and after each filter and dryer at full flow. A rising pressure drop identifies saturated filters, fouled elements, or a dryer problem; confirm by checking differential-pressure indicators and service records.
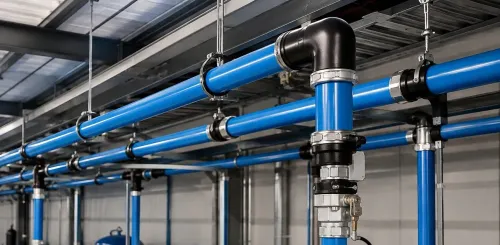
- Distribution restriction: compare pressure at the receiver, remote header, and point of use during peak demand. A large pressure drop points to undersized piping, blocked isolation valves, or poor fittings.
- Drain and condensate fault: inspect automatic drains for cycling, blockage, and continuous discharge. A failed open drain wastes air; verify oil-water separator performance and disposal records for oil-contaminated condensate.
- Wasteful end use: shut off one application at a time and watch flow and pressure. A large flow reduction without production loss identifies a control, nozzle, open-blow, or equipment fault.
Convert the Audit into a Prioritised Improvement Plan
Rank improvements by production risk, recoverable energy, pressure impact, and payback. Fix losses that distort every later decision first: leaking valves, failed drains, blocked filters, and unsafe condensate discharge. Then address control and capacity problems.
| Action | Audit evidence | Priority decision |
|---|---|---|
| Repairs | Pressure drop or leakage at a specific component | Repair before buying capacity |
| Controls and storage | Rapid pressure swings, short cycling, or intermittent peaks | Review receiver sizing and add storage near the demand |
| Treatment | Filter loss or a process requiring tighter dryer pressure dew point | Treat only that branch to its ISO 8573-1 air quality class |
| Sequencing | Compressors unload together or run inefficiently at low load | Reconfigure sequencing before adding a compressor |
| Future support | Repeated faults, missing trend data, or unclear service intervals | Specify monitoring, spare parts, response times, and performance checks |
Use measured kW per m³/min at actual pressure and load to compare compressor options. A variable-speed-drive compressor suits a wide, changing base load; it is not automatically efficient when demand is steady or below its turndown range.
Do not distribute high-grade coalescing or adsorption treatment plant-wide when one machine needs it. Record the selected set points, receiver volume, pressure targets, dew point, condensate method, and acceptance test so future equipment support can be judged against the audit baseline.
Write a Report That Supports Safe, Measurable Decisions
A defensible air-audit report ties every recommendation to a measured baseline, stated assumption, and verification method. Identify the boundary from compressor intake to end use, including controls, receivers, dryers, filters, piping, condensate equipment, and heat-recovery points. ISO 11011’s data-collection, analysis, and improvement structure provides a useful framework.
Include these decision records:
- Savings: show kW, kWh, flow, pressure, loaded and unloaded hours, tariff, operating schedule, leakage estimate, annual energy-cost calculation, project cost, and payback. State how post-installation readings will confirm the result.
- Condensate management: name each drain and oil-water separator, record failures and air losses, attach disposal records, and identify the applicable discharge rule. Do not treat oil-contaminated condensate as ordinary wastewater.
- Heat recovery: document compressor input power, recoverable heat estimate, outlet temperature, available hours, pipe route, and the receiving load’s flow and temperature. Reject the project if no coincident hot-water, space-heating, or boiler make-up demand exists.
- Supplier recommendations: specify required pressure, flow, control response, efficiency at actual inlet conditions, service intervals, spares, warranty, and acceptance tests. A recommendation from SS Quality Air Solutions is verifiable only when its scope includes the compressor service and piping review, measurements, and post-work results.
Reserve an appendix for meter locations, raw time-series files, calibration details, photos, and calculation formulas.
Related products
 | Compressed Air Pipe Aluminum Compressed Air Pipe with Grove Fitting Aluminum air piping systems are designed to reduce installation times by up to 75% when compared to traditional black iron and copper piping systems. View product → |
 | Compressed Air Pipe Aluminum Compressed Air Pipe with Push Fitting Compressed Air Aluminum Piping System is a new concept which is basically using Push In fittings to join aluminum pipe. View product → |
Frequently asked questions
What should an air audit include?
Include compressors and controls, receivers, dryers, filters, piping, hoses, end uses, drains, oil-water separators, and heat-recovery equipment from air intake to condensate discharge.
Why measure compressed air during production and shutdown?
Production measurements reveal operating demand and pressure behaviour. Shutdown measurements expose base load, including leaks and equipment that continues consuming air.
How do you distinguish leaks from artificial demand and restrictions?
Compare flow and pressure readings across operating states and locations. Persistent shutdown flow indicates leakage; inappropriate uses indicate artificial demand; pressure loss between points indicates distribution or treatment restriction.
How should an air-audit improvement plan be prioritised?
Rank actions by verified energy or capacity benefit, implementation cost, production risk, safety, and the measurement that will confirm the result.